ARRAY WHITEPAPER
How Trends in Credit Card Management Reflect Our Macroeconomic Environment
Part of what drives our understanding of what the market needs lies in the data. We evaluate and analyze the trends we see over time to understand the interplay between macroeconomic factors and consumer behavior. These insightful indicators serve as our compass, guiding us through the intricate relationship between economic shifts and their impact on consumers.
To understand where we need to go to better serve our clients, we need to understand where we’ve been. This paper serves to share the insights gleaned from our data so that others are empowered to make informed decisions about their financial journeys as well.
So, let's delve into the intricacies of prevailing credit trends to understand what they reveal about our economy and its consumers.
An overview of the metrics
Before we dive into the findings, we wanted to provide a quick explanation of the various metrics our team evaluated across time to understand the impact that our economy has had on consumers’ liabilities over the past several months.

Number of open credit card (cc) accounts
Generally, the more credit card account openings there are, the lower the interest rates tend to be and the cheaper it is for credit card issuers to lend to consumers. In an environment where rates are cheap, consumers can be perceived to be more creditworthy as they’re more equipped to meet their credit obligations on average. An increase in the number of credit card account openings is taken to be a positive sign as this can likely mean that the cost of borrowing is lower. Likewise, if this trendline decreases, we can infer that consumers are tightening their wallets and that interest rates may be rising as lenders increase the cost of borrowing.
Number of closed credit card (cc) accounts
When consumers close their credit card accounts, it can either mean one of two things:
- Either they’re having a more difficult time paying off debts and they're consolidating their debts, transferring balances to more advantageous APRs or
- Consumers’ debts are now going into collections or into default and lenders are changing the status of their accounts from open to close.
The inference then is that an increase in closed cc accounts means an economy under pressure and that consumers are struggling financially to meet their obligations. On the other hand, a decrease in closed cc accounts over time generally means that consumers are keeping more tradelines open, are better equipped to meet their debt obligations and are in a more financially healthy position.
Credit limit per account
A credit limit refers to the maximum credit amount granted by a financial institution to a customer, applicable to either a credit card or a line of credit. Lenders typically determine credit limits by evaluating specific details about the applicant, such as their income and employment status. Increasing credit limits per account can signal a variety of trends and is not necessarily indicative of a strong or weak economy.
Unpaid balance per account
Our data team also looked at the unpaid balance ($) on average per account across age groups and score bands in addition to the unpaid balance as a percentage of the credit limit.
Average number of credit cards
We were interested to learn what the average number of open credit cards were across age groups and score bands.
The data is in line with macroeconomic trends
We’ve all felt the squeeze. With the seemingly pervasive and persistent rise of food prices 11.4% last year (following increases of 3.5% in 2020 and 2021), U.S consumers continue to experience grocery store sticker shock as consumers have undergone the largest annual increase in food prices since the 1980s.
Some Americans are seeing a bit of a reprieve however with wages finally outpacing inflation—allowing workers to gradually catch up on lost purchasing power. But it’s not clear whether this trend will last. The real variable is whether inflation rates will continue to fall faster or if the labor market softens which will lead to smaller raises for workers.
DIFFERENCE BETWEEN THE INFLATION RATE AND GROWTH OF WAGES
IN THE US FROM JAN 2020–JUL 2023
Source: Statista, August 2023
And though inflation has cooled down, tight labor markets and a 22 year high interest rate are sure to continue to put downward pressure on consumers for the foreseeable future.
But what effect did the past year have on consumer debt across the country?
The impact of macroeconomic conditions varied across demographics
Different demographics have varying needs—from prioritizing paying off student loans, to getting a home equity loan, to paying off debt before retirement, the fluctuations of our economy have disparate impacts on each individual’s financial well-being and future financial prospects.
What we observe from our data is that an individual’s age, score band and where they live have an impact on their personal balance sheet—contributing in different ways to their assets and liabilities.
The economic constraints of the past few months have certainly had an impact on credit card account activity. In general, the average open number of credit cards held steady over time indicating that consumers weren’t rushing to open new credit cards. This makes sense as interest rates increased over time, making it more expensive for consumers to borrow.
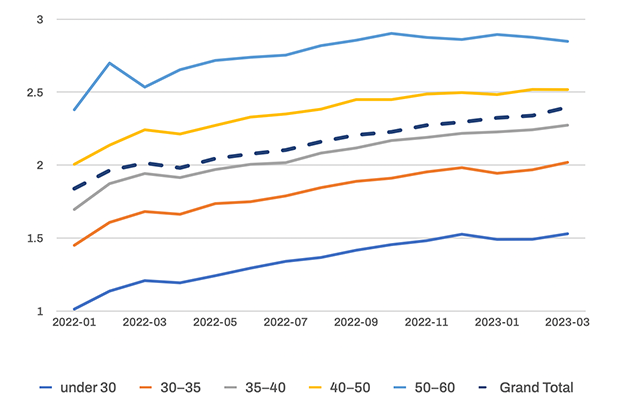
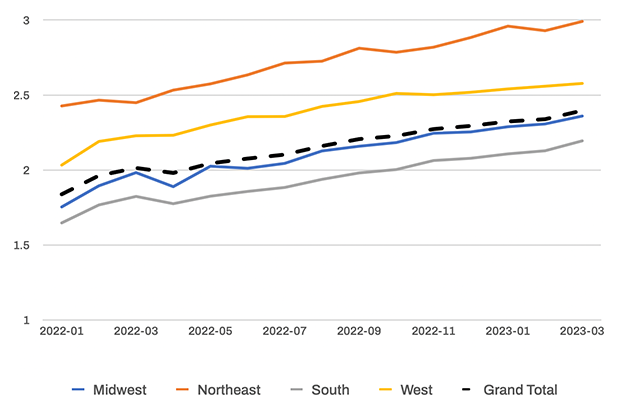
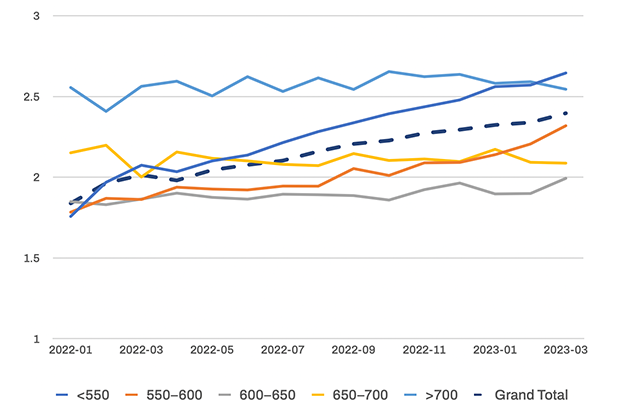
In contrast, the number of closed credit card accounts increased over time—across ages, regions, and score bands.
AVERAGE CLOSED CC ACCOUNTS BY AGE
Source: Array Internal Data, as of August 2023
AVERAGE CLOSED CC ACCOUNTS BY REGION
Source: Array Internal Data, as of August 2023
We can see the impact that the macroeconomic environment has had on consumers, reflected in these rising rates of closed credit card accounts.
Closing one account each year is not an insignificant endeavor given the impacts it can have to one’s credit score. If anything, this trend is a commentary of just how distressing current economic conditions have been through a myriad of swirling factors including high interest rates, growing unemployment and high inflation.
Credit card closes across score bands and time
While we saw similar increases in credit card closes across age groups, perhaps the sharpest increase in cc closes was with consumers who had credit scores of 550 or lower.
As consumers’ purchasing power weakens and as inflation takes a toll on our wallets (with wage hikes lagging behind), it becomes more difficult to pay off debts. Consumers then turn to consolidating their loans and credit cards which can help alleviate financial burdens.
AVERAGE CLOSED CC ACCOUNTS BY SCORE
Source: Array Internal Data, as of August 2023
Score band and regional differences in unpaid balances
It’s a similar story if we look at unpaid balances as a percentage of the credit limit. While the lowest score band tends to hold the highest unpaid balance percentages, the highest score band (greater than 700) holds the lowest—trending at roughly ~45%. The inference here is that those with a score of greater than 700 have more cash on hand to pay down their balances more effectively than perhaps other score bands would.
The data also highlights differences across regions as well due to cost of living differences.
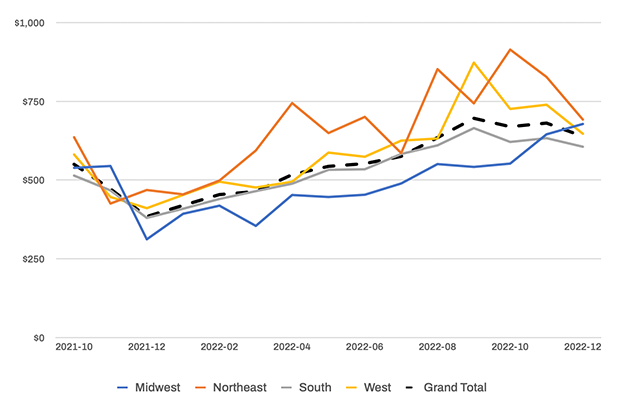
For example, the Midwest generally held the lowest average unpaid balance per account whereas the Northeast held the highest average unpaid balance per account.
Given that the ten states with the highest cost of living are on the coasts (with the exception of Alaska and Hawaii), the high costs of basic necessities including food, energy, transportation, and healthcare may be contributing to higher unpaid balances in the Northeast and West regions. In contrast, the ten states with the lowest cost of living are all located within the Midwest and the South region with Mississippi flanking the list as the state with the lowest cost of living in the U.S.
UNPAID BALANCE % BY SCORE BANDS

Source: Array Internal Data, as of August 2023
UNPAID BALANCE PER ACCOUNT BY REGION
Source: Array Internal Data, as of August 2023
Differences in credit card management across ages
We’re also seeing older generations accumulate more debt than their younger counterparts. In fact, total household debt for those over age 60 more than quadrupled over the past 20 years, to $4 trillion, according to Federal Reserve data.
Fixed incomes combined with inflation and rising interest rates can make it extremely challenging to prudently manage debt.
UNPAID BALANCE PER ACCOUNT BY AGE
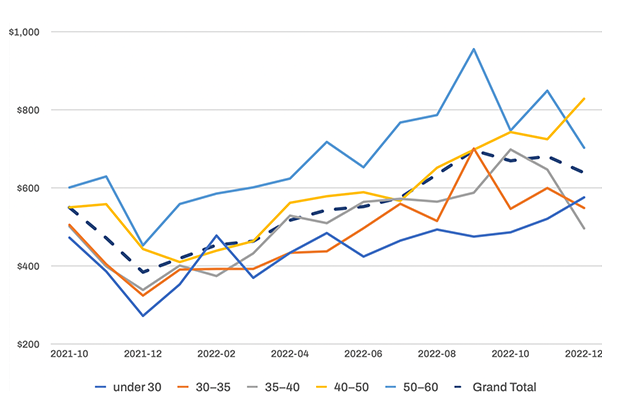
Source: Array Internal Data, as of August 2023
AVERAGE OPEN CREDIT CARDS BY AGE
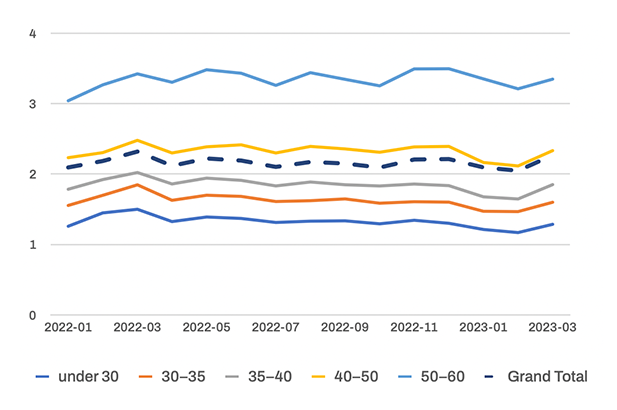
Source: Array Internal Data, as of August 2023
Interestingly, those in the 50-60 age bracket have at least one more credit card than other age groups.
Whether the difference is due to factors like multiple mortgages or the pressure of funding their children’s college educations remains unclear but the simultaneous rise in both debt and age may serve as a cautionary tale to younger generations.
In fact, we’re seeing a positive relationship between age and the number of credit cards one has and a positive relationship between score bands and number of credit cards.
It’s fair to assume that consumers are exposed to more credit card offers over time and are able to expand the types of credit cards they can use given an increase in experience, income and net worth. Similarly, those with higher credit scores are more likely to get approved for additional credit cards which may explain the positive relationship.
AVG NUMBER OF CREDIT CARDS BY SCORE BANDS
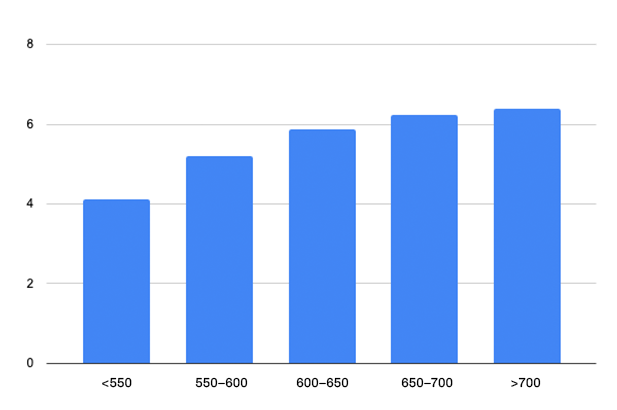
Source: Array Internal Data, as of August 2023
While we are witnessing a gradual decline in retail prices, consumers continue to feel the weight of ballooning costs on their monthly statements. We can see that over time with increases in unpaid balances across demographics.
AVG PRICE: CHICKEN BREAST, BONELESS (COST PER POUND) IN US CITY
Source: US Bureau of Labor Statistics, as of August 2023
AVG PRICE: MILK, FRESH, WHOLE, FORTIFIED (COST PER GALLON) IN US CITY
Source: US Bureau of Labor Statistics, as of August 2023
AVG PRICE: EGGS, GRADE A, LARGE (COST PER DOZEN) IN US CITY
Source: US Bureau of Labor Statistics, as of August 2023
Unfortunately those with lowest credit scores have been hit particularly hard as they represent the highest unpaid balance (%) and are experiencing closing credit cards at a higher clip than their counterparts.
UNPAID BALANCE % BY SCORE

Source: Array Internal Data, as of August 2023
UNPAID BALANCE % BY REGION

Source: Array Internal Data, as of August 2023
UNPAID BALANCE % BY AGE

Source: Array Internal Data, as of August 2023
What can fintechs and financial institutions do to help?
In a recent Quicken survey, 35% of Americans with credit cards admit they won’t be able to pay off their cards before the end of the year and over 39% of Americans aren’t confident with the state of the economy.
During times of economic hardship, consumers need somewhere to turn to for guidance. And oftentimes, that starts with providing the basic tools and features that consumers are expecting from their primary financial institution which includes capabilities like: free credit monitoring, credit building products, identity theft and privacy protection services, mobile banking, subscription management, bill management and negotiation services, and automated savings and investing.
Consumers know they’re struggling and it’s not for lack of trying.

“Nearly two-thirds (62 per cent total) of already employed Americans said they are either considering a side gig in the next six months (47 per cent) or currently planning on looking for a second job in the next six months (31 per cent).”
QUICKEN SURVEY, JULY 2023
Though economists have lowered their estimates that a recession will start in the next 12 months, “thirty-nine percent of Americans are living paycheck to paycheck and don’t see an end in sight.”
However, fintechs and financial institutions are well positioned to lean in with an incredibly customer centric approach by providing the tools and solutions consumers need today to help manage their financial well-being. By listening to customers, understanding the impact that economic fluctuations are having on their financial stability and offering the products they’re clamoring for, fintechs and financial institutions can begin to engender and build on the trust that serves as the foundation for a robust customer relationship.
In turn, when consumers are feeling a bit more optimistic about their financial future, the organizations that have successfully positioned themselves as a trusted partner will be the first ones they turn to.
Contact us to learn more about embedding financial products into your digital experience.
About Array
Array fuels financial progress for many of the world’s leading fintechs, financial institutions, and digital brands with a suite of private-label fintech solutions that can be easily embedded. Array drives engagement and revenue for our clients by helping them stand out in a crowded market and forge deeper relationships with their customers. More than a suite of products, we’re building a platform to help consumers own their financial future.
Key investors include Battery Ventures, General Catalyst, and Nyca Partners. To learn more visit array.com.


